These tools are used to visually analyze and select points in the scene, following geometric constraints.
After the tool is activated, the user can choose different modes, which share common options:
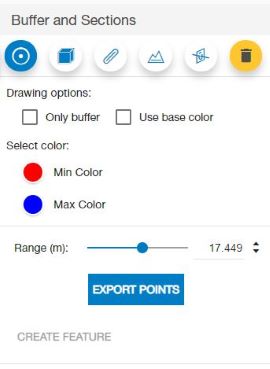
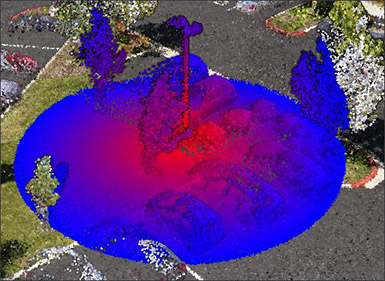
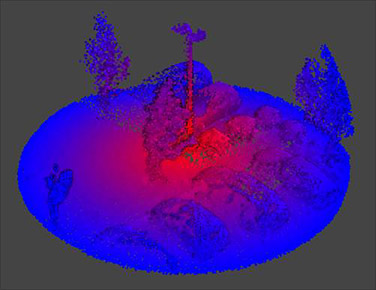
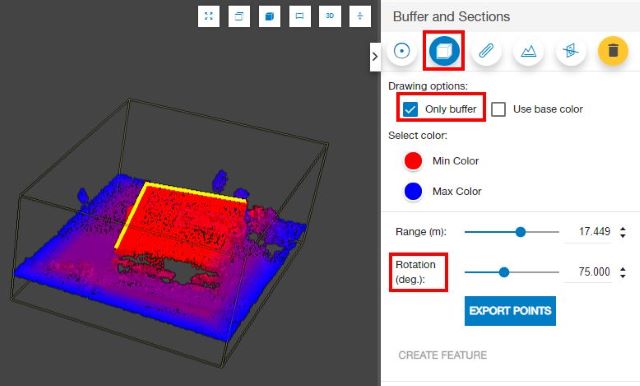
In this mode (see image above), the user picks a center point, and all points within a certain 3D distance (Range) of this center point are selected.
Initially, the center is moved interactively with the cursor, until the user clicks with the mouse. From that moment, the center is fixed, until the user hits the ESC key to move it again.
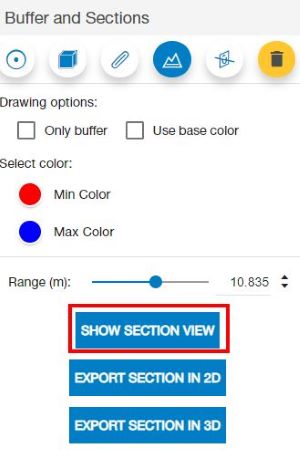
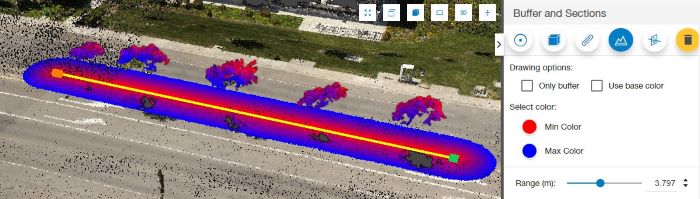
As in the other modes, the user can change the color used for the minimum distance (zero) and the maximum distance (given by the Range value in the slider).
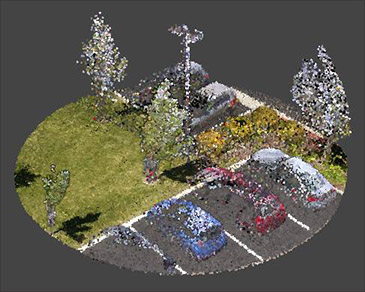
Also, in all the modes the user can choose to display only the selected points or to draw them with the original color:
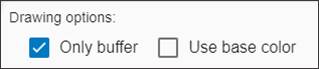
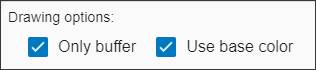
Note that, after defining a buffer with the "Only buffer" option, you can use the Information, Measurement and Editing tools. Their operation will then be limited to the selection defined by the buffer.
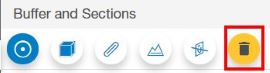
To remove the buffer selection before using other tools, click on the "Clear buffer/section" button.
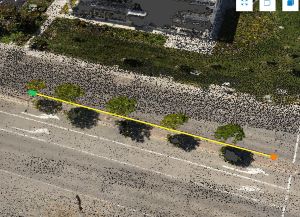
In this mode, the user draws a 3D line. This line defines an enclosing box. All the points within a certain 3D distance (Range) of this box are selected.
The enclosing box can be rotated using the Rotation parameter in the tool panel.
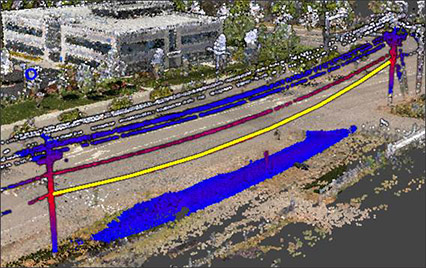
This mode select points within a certain 3D distance of a line drawn by the user. For instance, the user may want to know which points are closer to a cable or pipe in 3D.
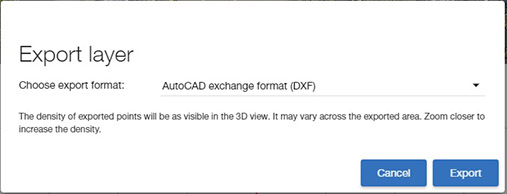
The points defined by a point or line buffer can be exported to a local file by using the "Export points" button in the tool panel. The exported points will have XYZ coordinates. If the layer has a coordinate reference system and it is different from the project one, the exported data will be reprojected to the Project CRS.
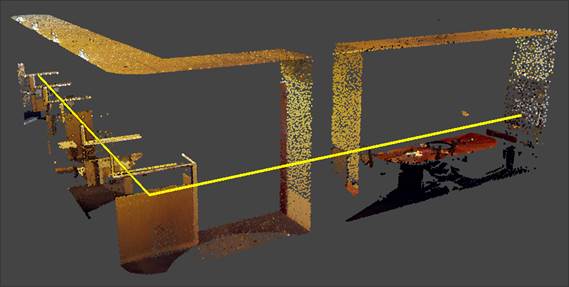
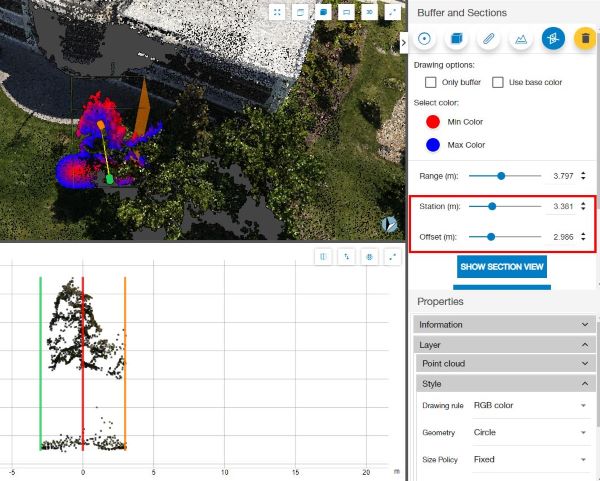
This tool also uses a line, but selects points which are closer in X and Y, regardless of their height, so the result is a longitudinal section of the point clouds along the line. It can be used for topographic profiles and creating vertical cuts of the data.
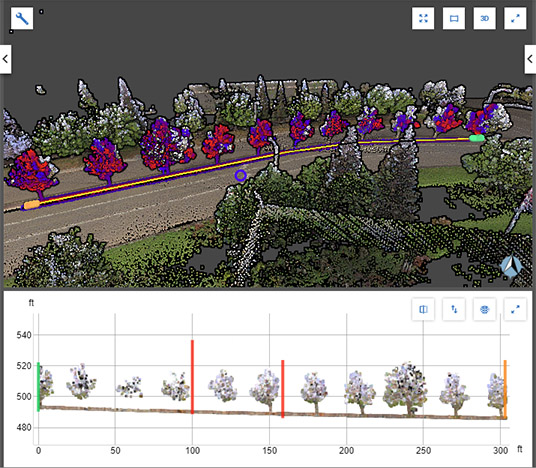
By using the "Show section view" button, the user can display the selected points in a Section View.
In the Section view the user can zoom and pan to explore the data. The view can be expanded like the 3D and Map views.
Please note that the Section view does not show all the detail of the original data, only points visible in the 3D View. If the user wishes to see more points in the section, he/she must zoom closer in the 3D View and then click on the "Show section view" again to refresh it.
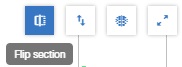
The "Flip" button can be used to flip the section left to right.
The vertical scale of the section view can also be changed.
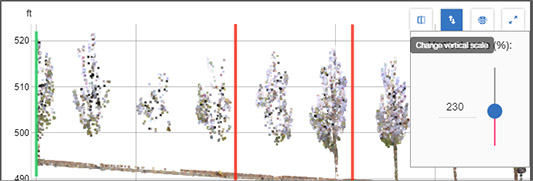
In addition, notice that the units used in the section view can be changed in the project Preferences tab.
The section points can be exported to a file by using the "Export section in 2D" and "Export section in 3D" buttons. In 2D export, the data will have XY coordinates, as in the Section window.
In 3D export, the points will have XYZ coordinates. If the layer has a coordinate reference system, and it is different from the Project's, the exported data will be reprojected to the Project CRS.
This mode works with a center line, same as the longitudinal section, but selects points across a perpendicular plane. In addition to the Range, the user can change the Station of the perpendicular plane along the line interactively, as well as the distance from the line (Offset).
Cross section points can be exported to files, in the same way as longitudinal sections.
If you already have a point or line in a vector layer, select it using the Information tool and switch to the Buffer/Section tool. The selected feature will automatically be used to define the buffer or section. If the feature is a point, you need to choose the point buffer; if it's a line, choose a line or section mode.
The buffer and section tools also operate on vector feature layers, including 3D models and meshes. They can be used to create cut-off views of complex models.
However, note that the Section view does not display vector data, only point clouds. Also, the buffer/section export tools do not save vector data, only points.
