The Project Viewer is Collage Web's component to display, work with and export mass data.
When a Project name or thumbnail is selected in the Projects page, the viewer will open automatically, loading the project layers and displaying them in the views.
Note: if you see an error message about some layers failing to load in the project, or some layer fails to display, your user may not have permissions to access the data. Please check with your organization's account administrator.
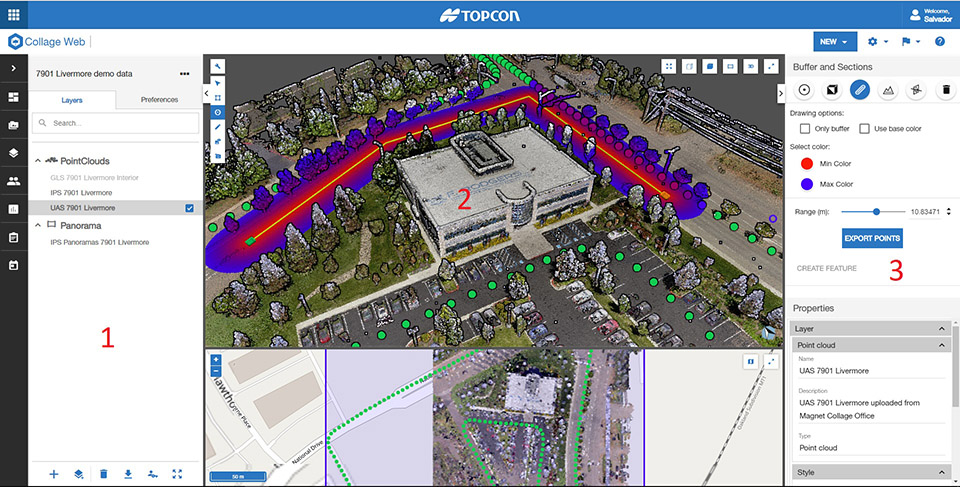
The Project Viewer area is organized in panels to display and work with the data:
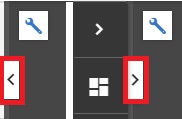
The left and right panels can be resized by dragging their borders, and collapsed by clicking the side buttons:
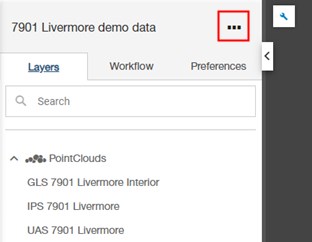
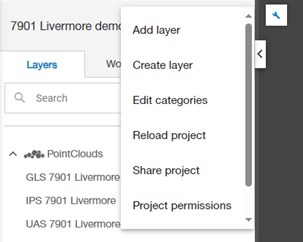
In the left panel, the three-dot project menu next to the project name offers commands to manage the content of the project.
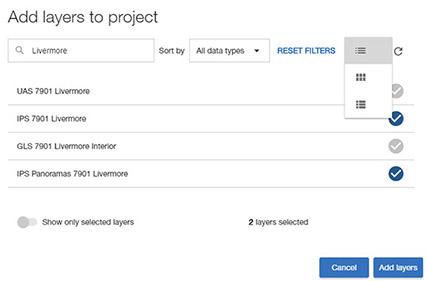
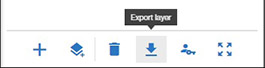
The user can add existing layers to the project by using the "Add layer" command from the Layers tab menu. This command opens the Layer Browser, where the user can select one or more layers to add to the project.
Similarly to the Layers page, in the Layer Browser we can filter by layer type and name. We can also choose a grid or list view of the layers.
In the next sections of this online help, we will see how the other project menu commands work.
This tab is in the left panel. It shows the layers included in the project, grouped by type or category.
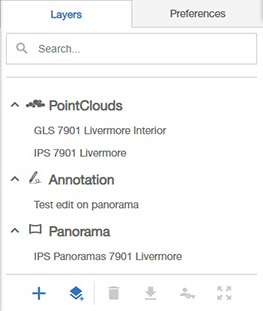
In the Layers tab, the user can:
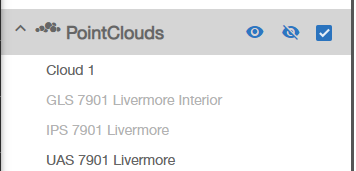
For groups, these operations are possible:
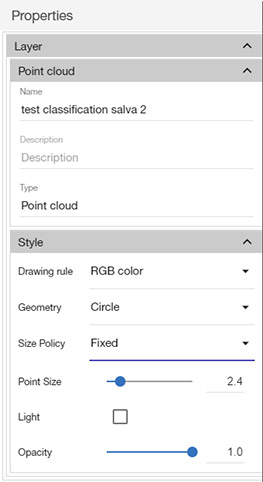
By selecting a layer (or layer group) in the Layer Manager, we can see its attributes or options in the Properties area at the bottom of the Right Panel.
In this area the user can see general layer properties like Name and Description. These properties can be edited, and will be saved automatically in the project after a few seconds.
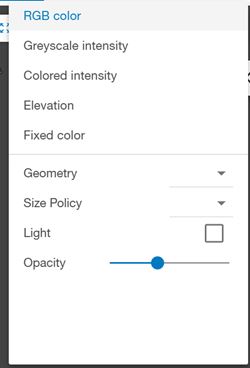
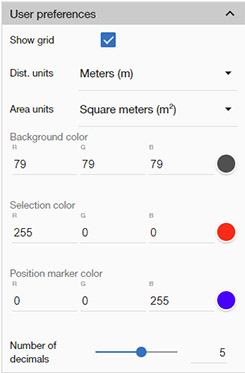
In addition, the layer Style properties depend on its data type. For point clouds, Style properties allow the user to select:
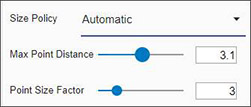
In addition, point sizing can be Fixed or Automatic. In the second case, the distance to neighbor points is used to calculate the size of the point. In this Automatic mode, some isolated points might get very large, so the user can modify the "Max Point Distance" property to limit the maximum size. Also, we can tune the automatic size calculation using the "Point Size Factor".
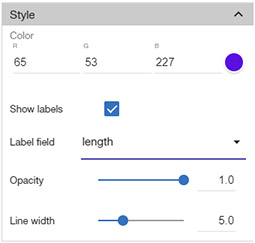
For vector feature layers, the user can see (but not edit) the geometry type in the general properties. Also, the color used to draw the features can be changed by providing RGB values or by clicking on the color selector.
Features can be labeled by switching on the "Show labels" property and selecting one of the layer attributes as "Label field".
Point features have an additional property to change the point size, and line features to change the line width.
It is possible to apply different symbols depending on the feature field values (attributes), using rules. We will see this advanced styling in the section about feature layers.
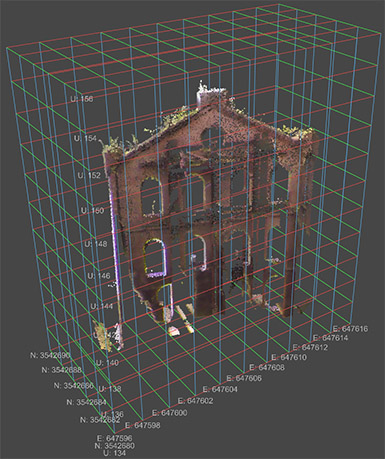
The 3D View is the default view. It shows the data in a 3D space, and provides:
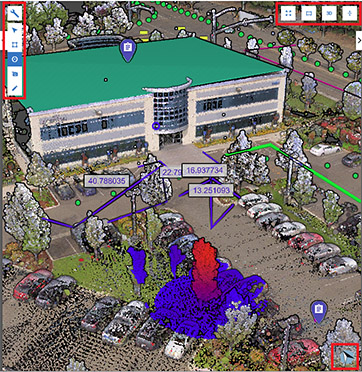
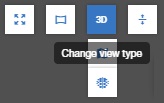
One of these option buttons allows the user to show the Map View or Section View instead of the 3D view:
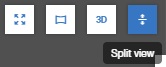
Another option button allows the user to split the view in half, or alternatively, to expand it to cover the entire viewing area.
To navigate in the 3D View:
The user can zoom out to full data extents by clicking on the "Reset extent" button:

A different navigation mode is the "Panorama" mode. By clicking on this option button, the user can "look around" by clicking and dragging the left mouse:

To leave the panorama mode and go back to normal mode, use the Exit panorama button:

In the default perspective projection, the user can also select a predefined orientation:
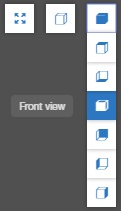
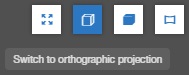
It is also possible to switch to a parallel (ortho) projection:
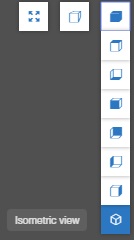
In ortho projection, the user can also select a predefined orientation, including the isometric orientation:
This button allows the user to control the global setting of the point cloud style and visualization in the project.
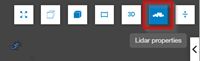
All the options listed image below, permit the user to configure globally the drawing and geometry rule style detailed in this section.
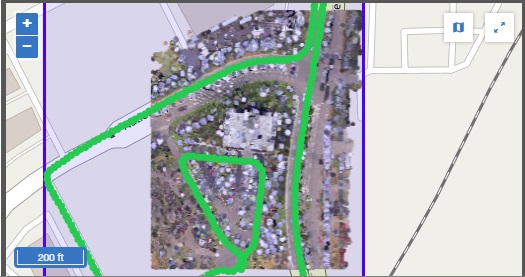
If the layers use a standard coordinate system, the Map view will show them overlaid on an OpenStreetMap background map.
The Map View includes the same view control tools as the 3D View, to switch to another view or expand the Map.
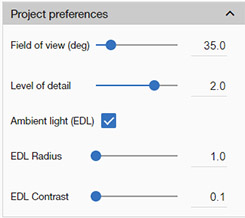
This tab is in the left panel. It shows the editable project and user preferences.
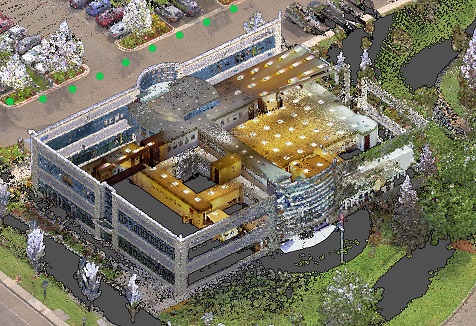
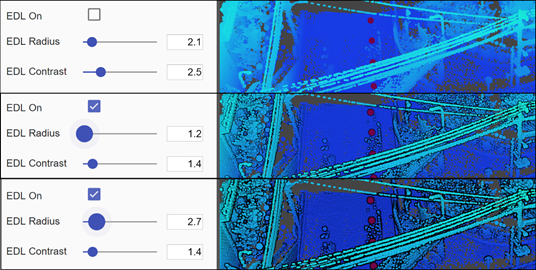
This image shows the result of applying Ambient Light (EDL) options:
These are not linked to a specific project:
Each new user (or a public user accessing a shared project) see the project with a default configuration (including layer styles and user project preferences).
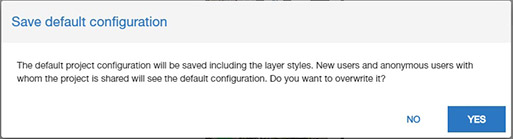
Users with administrative privileges can overwrite at any time this default project configuration by using the button at the bottom of the Preferences tab:
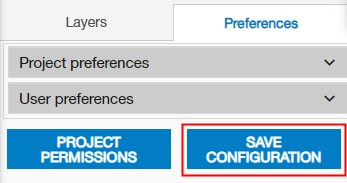
A dialog will popup to make sure you want to overwrite the default configuration: